During the course of the current World Cup, we’ve seen a perceived gap emerging between the Northern and Southern Hemisphere sides. For the first time ever, all 4 semi-finalists have come from south of the Equator. However, 4 years ago we had a NH finalist and SF, and the same 4 years prior. Has it all really switched around in the intervening 8 years to the extent that NH teams are dragging far behind their southern counterparts?
To really review this, though, and whether a trend has been set, it should be noted that the record of 6N sides against the SANZAR nations has always been poor at World Cups. For now, we’ll exclude Argentina to look at some facts:
Ireland’s only win against a SH side at a World Cup came against Australia in 2011. No other NH sides beat a SH one in this edition.
In 2007, England beat Australia and France beat NZ.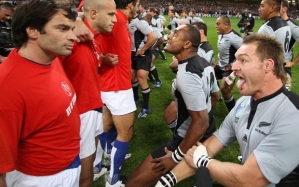
England’s run in 2003 is the only time a Northern team has beaten 2 Southern teams at the same tournament, notably SA in the pool stage and the Aussies in the final.
In 1999? Just one win for France against NZ.
England again carried the flame in 1995 beating Australia before Lomu trampled all over them.
1991 didn’t include South Africa, but still no NH team could muster a win against the South.
There were two wins in 1987, with France winning a semi-final against Australia in Sydney and England’s westerly neighbours winning the semi-final losers play-off.
Ignoring the numerous defeats:
Ireland – 1 win
England – 4 wins
France – 3 wins
Scotland – 0 wins
Italy – 0 wins
Wales – 1 win
One third of the Six Nations have never beaten a Southern Hemisphere team. And almost half (4 of 9) of the total wins come from a team who couldn’t make it out of the group this time.
1987 – none
1991 – Wales
1995 – England
1999 – Wales
2003 – Ireland
2007 – none
2011 – England
Still doesn’t make good reading, does it, especially when you throw in the fact they’ve defeated Ireland 3 times at World Cups, France twice, Scotland a couple…
So ask yourself, have standards really dropped for Northern Hemisphere sides in 2015, or are we just seeing a pattern continuing?
___________________________________________________________________________
Now, there’s the facts out of the way, let’s get down to the reality.
Whilst the results versus the Southern Hemisphere haven’t worsened significantly (fact!), you could argue, and I do, that the performances have.
Taking 2011, France were easily turned over by NZ during the group stages whilst the team was in turmoil. Weeks later they only missed the big prize by a point, in the face of some close refereeing calls. Fast forward four years, and they’re being dismantled, by a slick, exciting New Zealand side playing some of the best rugby we’ve ever seen. The French didn’t know where to turn.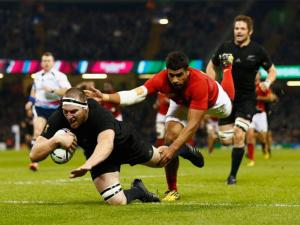
Similarly, Ireland topped their pool in 2011 by beating Australia, and pretty comfortably, too. Their bonus was avoiding SA but they tripped up anyway. 2015 arrives, and they top their pool, avoiding the aforementioned All Blacks… and get dismantled by a pacy, no-fear Argentine team which will only get better.
So why?
The two theories I’ve seen banded around are:
- NH play too much rugby
- The style of rugby played in the NH suits only the NH and is not conducive to winning on the world stage.
I’m going to look at point 1 first, because, well, 1 comes before 2.
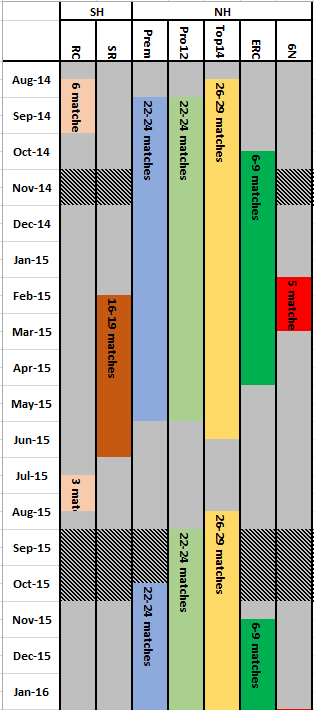
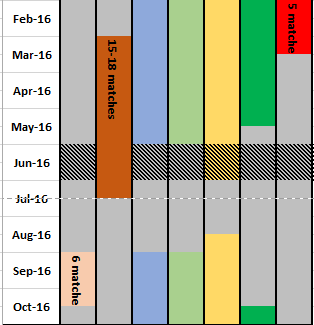
NB: This excludes RWC and matches between SH/NH teams in June/July and Oct/Nov, where the number of games played, and conditions played in, is similar (these are hashed in the table below)
SH players for Super Rugby + Internationals:
2015 – Feb to July, July to August – 7 months, max 22 matches
2016 – Feb to July, August to October – 7 months, max 24 matches
From August 2014 to October 2016 – 53 matches (26 months)
NH players for Domestic League, Europe + Internationals:
2014/15
England – September to May – 9 months, max 33 matches (6N games clash with club matches, so can’t play both!)
Ireland, Scotland, Wales, Italy – September to May – 9 months, max 33 matches
France – August to June – 10 months, max 38 matches
2015/16
England – October to May – less than 8 months, max 33 matches
Ireland, Scotland, Wales, Italy – September to May – 9 months, max 33 matches
France – August to June – 10 months, max 38 matches
From August/September 2014 to May/June 2016 – 66-76 matches (23 months)
Before I started this, I didn’t have an expectation. I suspected the European matches would add more games but what I didn’t factor was the playing time, the length of the seasons.
In the Southern Hemisphere, the season is much more condensed, breaks are taken from Super Rugby for Internationals and the offseason is August to February, with the exception of the month of games in Europe. That is a solid 5 months break, with a month-long tour in the middle. Of course, there is training and pre-season, but that break is pretty significant. Let’s also not overlook the shortening of the Rugby Championship in 2015 to give their teams more time to prepare.
In contrast, the northern hemisphere seasons are much more spread out. The home nations usually have a 3 month break, of which one is spent in the Southern Hemisphere on tour. France is even worse with around 2-2 ½ months between one season ending and another starting, with the same tour in between.
On top of this, over a similar two year cycle, NH teams might play anywhere from 13 extra matches, up to as many as 23, fitness, injuries and form permitting, compared to their southern counterparts.
From the first to the last at this World Cup, the North has looked off the pace compared to the South. You’d be hard pressed to think that the above doesn’t have an effect – both the number of matches and the length of off-seasons.
Let’s also not overlook the amount of injuries at the World Cup. There have been significantly more muscular injuries than impact injuries, which is indicative of pushing the body to the limits (and some bad luck, of course).
Like many others, I’ve presented a problem without coming up with a solution. It’s easy to pick bones, but is it easy to correct?
Far from it, but when I answer question 2 next week, I’ll put forward some suggestions, too!

Regarding the playing time between the two hemispheres does that actually translate into more minutes played in the NH over the SH? Are squad sizes the same or are the cash rich NH clubs paying for bigger squads? And don’t the Unions have some sort of central control over their players? Club V Country issues?
LikeLike
I haven’t looked at playing time by minute, that would be quite an effort! Most of the international players play most minutes for their clubs when available, with a few exceptions, so I’d be surprised if the overall results were that much different.
In the SH, teams are owned, or part owned, by the unions, similar to the Welsh regions. In England and France, they’re privately owned, so no incentive to really assist the national teams!
LikeLike
Just wondered how many extra matches NH players actually played over SH? If you took into account premiership, pro 12, currie cup, ITM etc to get a full account (and a normal not truncated Rugby Championship) of actual matches played what is the average difference? Great article by the way and especially the point over a reduced off-season.
LikeLike